Stop Guessing: A Six‑Dimension Framework to Compare AI Tools and Prove ROI
Ditch glossy demos. Use a six‑dimension scorecard—feature fit, accuracy and reliability, total cost of ownership, privacy and security, integrations and workflow fit, and measurable ROI—to select AI tools that deliver business value. Run controlled tests, price scenarios, and compliance checks to back decisions with data.
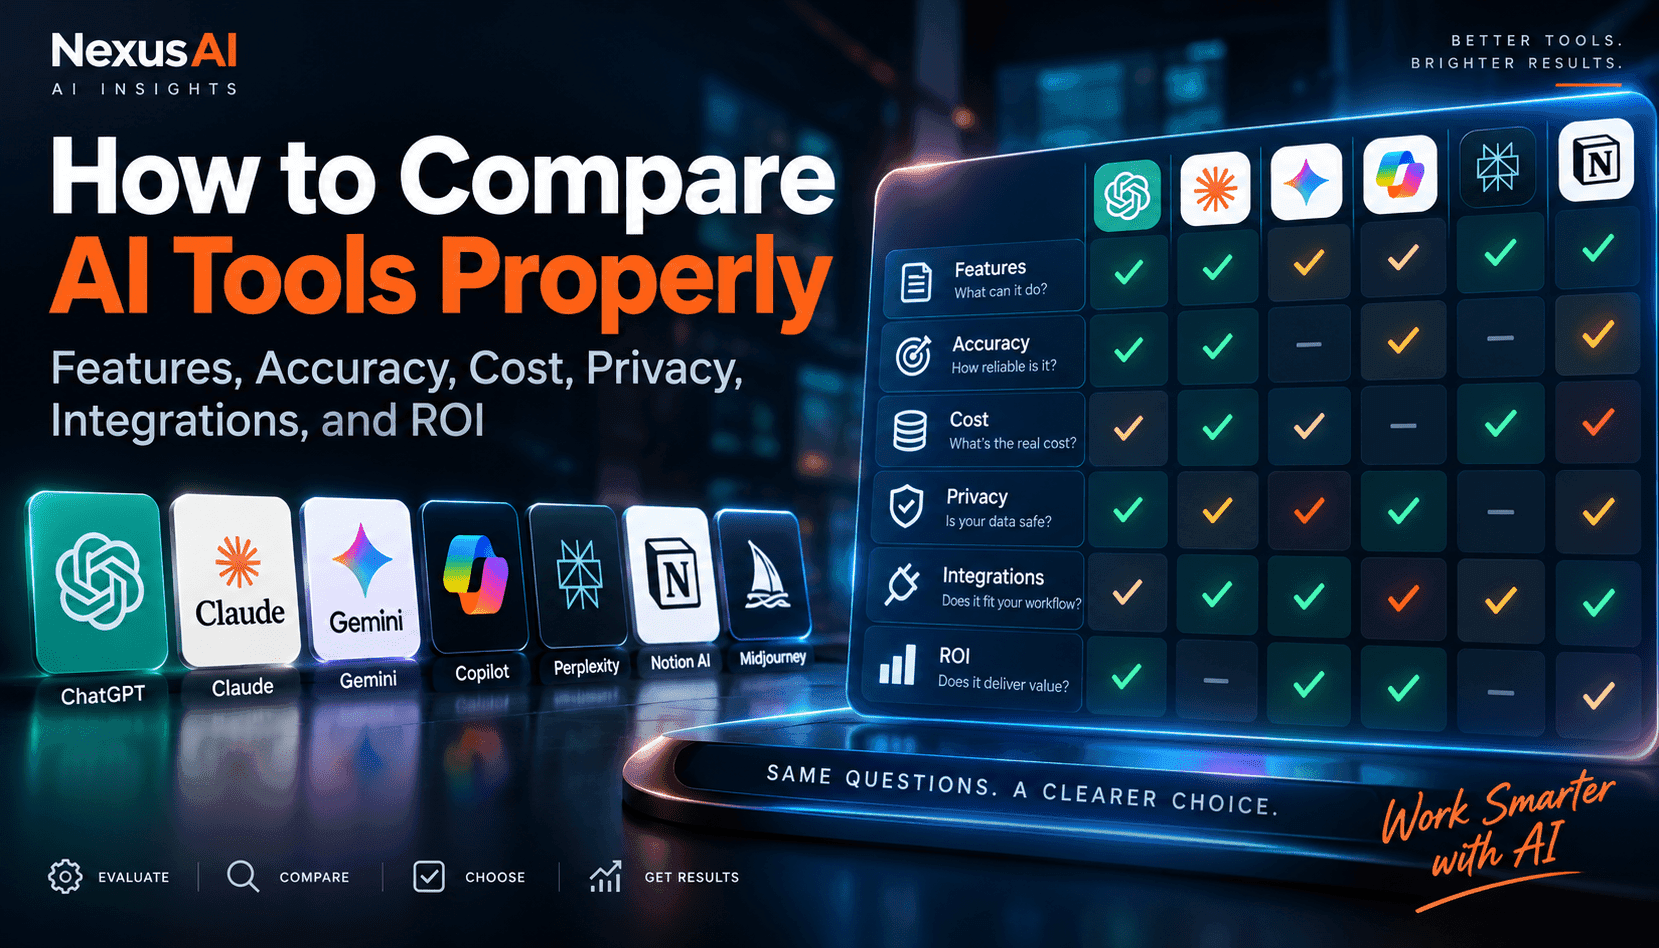
AI BriefMost AI tool decisions falter because they optimize for flashy benchmarks or brand recognition instead of fit and economics. This guide provides a practical, defensible framework for enterprise buyers and builders: a weighted scorecard across six dimensions, a controlled evaluation plan that measures real tasks, TCO modeling that surfaces hidden costs, privacy and compliance checks that legal can sign off on, and ROI math tied to time saved, quality uplift, revenue impact, and reduced operating expense. The result is a documented decision you can defend to finance, security, and operations—and a higher chance the chosen tool actually improves the workflow it’s meant to serve.
Marketing claims rarely survive contact with real workloads. The right AI tool is the one that fits your process, data, and risk posture while improving economics—not necessarily the largest or newest model. Anchor your evaluation on a six‑dimension scorecard: feature fit, output accuracy and reliability, total cost of ownership (TCO), privacy and security, integrations and workflow compatibility, and measurable ROI. Weight each dimension to reflect business priorities—e.g., privacy for regulated data, or latency for customer‑facing flows—and commit to a transparent scoring method so procurement, security, and finance can follow the logic from requirement to decision.
Design a controlled test that mirrors production. Define representative tasks, inputs, acceptance criteria, and pass/fail thresholds before vendors touch the data. Measure not only mean performance, but distributional behavior: tail errors, drift across datasets, and stability under prompt or context variations. Use blind reviews to reduce bias, log prompts and parameters for reproducibility, and benchmark latency variability because P95 matters in live systems. Capture integration effort and operational overhead—guardrails, monitoring, red‑teaming—as part of the score rather than an afterthought. Your goal is comparable, decision‑ready evidence across candidates.
Treat cost as a model of scenarios, not a line item. Compare subscription and usage‑based pricing by projecting request volume, context window size, retries, tool‑use frequency, and evaluation traffic. Include hidden costs: token sprawl, vector storage, egress, fine‑tuning runs, observability, and change management. Translate technical performance into economics with cost‑per‑successful‑outcome, not cost‑per‑call. Then quantify ROI from four sources: time saved, quality uplift (fewer defects or escalations), revenue lift (conversion, retention, upsell), and reduced operational cost (automation, consolidation). If a “weaker” model wins on cost‑per‑outcome and compliance, it’s the right choice.
Key Takeaways
Score What You Need, Not What’s Marketed
Use a weighted scorecard across six dimensions and require minimum thresholds per dimension. Public benchmarks inform, but your data and constraints decide.
Model Economics = Cost Per Outcome
Compare subscription and usage plans under realistic scenarios. Include hidden platform and people costs, and optimize for cost per successful task, not cost per call.
Compliance Is a Gate, Not a Tie‑Breaker
Validate data handling, residency, and certifications with evidence. If privacy or security fails, do not proceed—no amount of features compensates for risk.
Build the Weighted Scorecard
Start with unambiguous requirements. For each dimension—features, accuracy/reliability, TCO, privacy/security, integrations/workflow, ROI—list criteria and define how to measure them. Example: “Document summarization with citations” becomes tasks with ground truth, citation precision/recall targets, and latency thresholds. Assign weights that reflect enterprise priorities (e.g., 25% privacy for regulated teams, 30% ROI for budget‑constrained programs). Keep the scoring rubric simple: 0 (fails), 1 (meets), 2 (exceeds), multiplied by weight. Document rationale so changes in weights are auditable.
Avoid two traps: overfitting to public benchmarks and over‑weighting peak performance. Public leaderboards don’t capture your content, prompts, or guardrails; prioritize evaluations on your data. Likewise, a tool that occasionally shines but often stumbles will inflate support costs. Score both average quality and stability, and require minimum viable performance per dimension—no candidate should “make up for” a compliance failure with great features.
Run Controlled, Real‑World Tests
Construct evaluation sets that reflect real traffic: edge cases, multilingual content, low‑resource documents, and messy inputs. Standardize prompts and temperature settings; capture seeds and context length for repeatability. Measure accuracy with task‑appropriate metrics (exact match, BLEU/ROUGE, citation fidelity), reliability with run‑to‑run variance, and safety with red‑team prompts. Track P50/P95 latency and time‑to‑first‑token. Where human judgment is essential, use double‑blind adjudication with tie‑break rules and Cohen’s kappa to gauge agreement.
Operationalize what you test. Stand up a minimal pipeline: input sanitation, retrieval (if applicable), safety filters, logging, and evaluation hooks. This surfaces integration friction early—SDK maturity, rate limits, streaming behavior, error semantics—and converts anecdotal vendor promises into measurable developer effort. Record setup time, required custom tooling, and observability depth; these inputs feed both TCO and integration scores.
Price Scenarios and Total Cost of Ownership
Model three demand curves—low, expected, peak—and compute monthly costs under subscription and usage pricing. Include input/output tokens, context size, tool call chains, embeddings, vector storage, inference retries, evaluation runs, and egress. Add people and platform costs: engineering time for guardrails, prompt libraries, monitoring, and incident response; legal review and audits; change management and training. Express results as cost per successful task and cost per active user journey so alternatives are apples‑to‑apples.
Stress‑test risk: What happens if input length doubles? If quality requires higher‑capability modes? If rate limits throttle peak traffic? Build sensitivity tables and a switch‑over rule—e.g., at cost‑per‑outcome > X or quality < Y, route to a higher tier. This prepares procurement for renegotiation triggers and prevents surprise overruns.
Privacy, Security, and Compliance Checklist
Map data classes (PII, PHI, financial, IP) to processing locations and retention. Require data processing addenda, regional controls, audit logs, and a clear statement on training data usage (opt‑in/opt‑out). Validate redaction options, encryption in transit/at rest, key management, SSO/SCIM, role‑based access, and incident response SLAs. For regulated workloads, verify certifications and evidence—do not accept marketing badges in place of artifacts.
Test with realistic but sanitized data, then rehearse a privacy impact assessment. Confirm data residency paths end‑to‑end—including retrieval systems and telemetry. If model routing is used, ensure the strictest constraints propagate across all backends. Treat compliance as a pass/fail gate; tools that can’t meet it should not proceed to price negotiations.
Integrations, Ecosystem Fit, and ROI Math
Score ecosystem fit by looking at SDK stability, connector breadth, RAG support, evaluation tooling, and observability depth. Favor vendors that reduce glue code: native webhooks, streaming, function calling, retries, batch APIs, and first‑party plugins to your data stack. Evaluate change friction—versioning cadence, backward compatibility, and migration tooling—because the cheapest tool becomes expensive if every update breaks workflows.
Quantify ROI with a simple ledger: time saved (hours × loaded rate), quality gains (defect reduction × rework cost), revenue uplift (conversion/retention × margin), and operational savings (licenses consolidated, incidents avoided). Track confidence intervals and payback period. Present a final decision table: weighted score, cost‑per‑outcome, compliance status, integration risk, and payback. Select the tool that maximizes value for your specific workflow—not the headline benchmark.
Frequently Asked Questions
How should I set weights on the scorecard without biasing the result?
Align weights to business risk and value: elevate privacy for regulated data, reliability for customer‑facing flows, or ROI for cost‑sensitive teams. Get sign‑off from security, finance, and operations before testing, and keep weights fixed during evaluation to avoid outcome‑driven tuning.
What’s the fastest way to run a fair head‑to‑head without building full apps?
Create a thin evaluation harness: standardized prompts, seeded parameters, a small RAG layer if applicable, logging, and an adjudication script. Use representative datasets, blind human review where needed, and capture P50/P95 latency and variance. This surfaces quality and operational friction in days, not weeks.
How do I translate quality improvements into ROI my CFO will trust?
Link metrics to cash flow: time saved (hours × loaded rate), defect reduction (rework cost), and revenue impact (conversion/retention × margin). Use baselines from historical ops data, add confidence intervals, and report payback period and cost‑per‑successful‑outcome. Re‑estimate quarterly as usage scales.